MALDIVision
A Comprehensive Data Processing and Visualization Software for MALDI Imaging Mass Spectrometric Data
Matrix Assisted Laser Desorption Ionization Imaging Mass Spectrometry (MALDI IMS) is a promising new technology for visualizing the spatial distribution of analytes viz., proteins, peptides, lipids, drug candidate compounds and biomarkers present in a sampled tissue section. MALDI tissue imaging enables researchers to visualize multiple molecular distributions across the surface of a sample without the need for chemical labels or antibodies. MALDI IMS has been increasingly used for candidate biomarker discovery, drug metabolite profiling, lipid analysis and proteomics. MALDI tissue imaging contributes significantly towards disease diagnosis and is now being used to address a number of clinical questions in diseases such as cancer and organ development.
To apply MALDI Imaging technology for clinical purposes, it is essential to develop a computationally powerful data processing and visualization informatics tool which can aid in successful analysis of the large data files obtained during an experimental run.
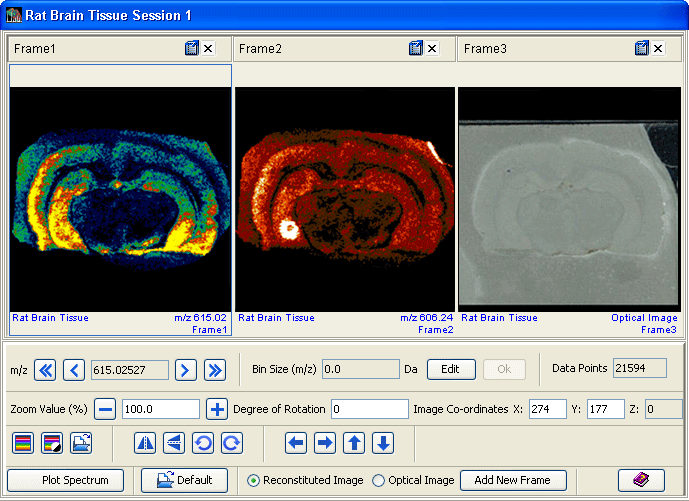
MALDIVision, a comprehensive bioinformatics tool for MALDI tissue imaging, facilitates data processing, visualization and analysis of spatial distribution of individual ions across the sampled locations on a tissue section. The program accepts imaging mass spectrometric data in standard file formats. MALDIVision generates an ion intensity map for any m/z in the analysis range, enabling simultaneous imaging of many compounds. Users can view images in 2-D and in 3-D. The program also facilitates displaying the reconstituted images as well as the optical image in different color gradients, so as investigate the localization of compounds present in a sample.
MALDIVision supports the selection of multiple regions of interest, display of mass spectra at a specific location and image manipulation tools to display images in 2D and 3D. The region of biological significance can be marked to observe the ion intensity distribution. MALDIVision enables scrolling through the m/z peaks of a mass spectrum which in turn facilitates in analyzing spatial distribution of peptides, lipids and metabolites in tissue compartments. Users can generate a histogram and cumulative probability graph plots to observe the ion intensity distribution in the defined ROI.

Read
more... |