Home >> Products >> GlycanExplorer >> Glycan Mapping
Comprehensive Result Display and Glycan Mapping
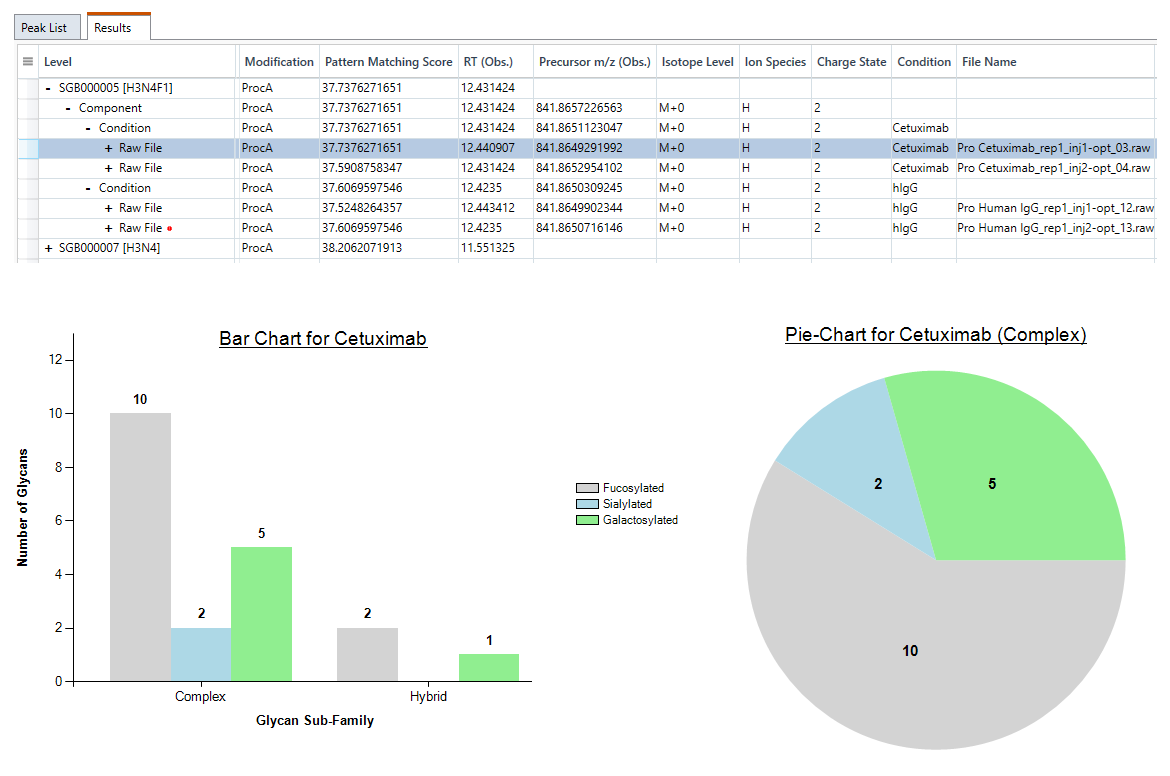
GlycanExplorer accommodates a comprehensive hierarchical data organization model. It displays the aligned peak lists which can be further expanded stepwise to view the biological samples, their technical replicates, and the corresponding isotopologues. The software reports the uniquely identified glycan structures, along with their components.
For every set of search results, the software allows you to fine-tune the parameters minutely and compare the output in real time helping you to find the optimized parameter set for your sample data.
The software generates Frequency table, ion Abundance table, interactive bar charts, and pie charts that gives a complete coverage of your data.
Key Features:
1. Extensive hierarchical data organization, which can be sequentially expanded to view all samples and replicates information.
2. The Frequency table and ion Abundance table presents a quantitative summary of the glycans in a sample.
3. Interactive bar charts and pie charts help visualizing the complete glycan profile of a sample.