Home >> Tags >> MSMS Data Analysis
Facilitating Identification of Glycerophospholipids and Glycerolipids with Details of the Fatty Acyl Composition using MS/MS Data
August 29, 2018
Over the decades mass spectrometry (MS) has evolved as the mainstay technology for characterization of complex bio-molecules such as proteins, peptides, glycans, lipids, and small molecule metabolites. MS-based workflows can overcome challenges to characterize complex molecules such as lipids.
Tandem mass spectrometry provides detailed information about lipid structures that facilitate identification of lipids not only based on their class specific headgroups but also on their fatty acyl composition. However, MS-based lipidomics analysis still poses a challenge, especially for interpreting millions of spectra for structural information. Advanced bioinformatics solution that can streamline data analysis for detailed structural characterization of lipids from MS/MS spectra is required to advance lipidomics research. We developed a software workflow for structural identification of glycerolipids and glycerophospholipids by using MS/MS results generated by SimLipid software. We have developed a workflow for complete characterization of lipid classes based on detailed fatty acyl composition.
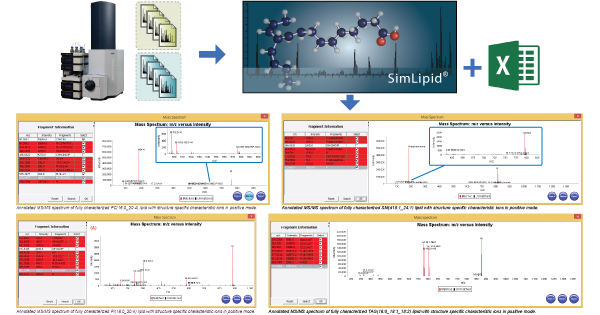
To demonstrate the workflow, we have acquired LC-MS and tandem MS data of lipids extracted from the NIST SRM 1950 Metabolites in Human Plasma by liquid-liquid extraction method using a Bruker impact II QTOF-MS instrument in data dependent acquisition (DDA) mode (ESI +/- modes). The data were subjected to SimLipid software for MS/MS database search for structural identification. Results obtained from SimLipid containing lipid IDs with annotated MS/MS spectra –m/z peaks, fragment names– were exported into MS Excel files.
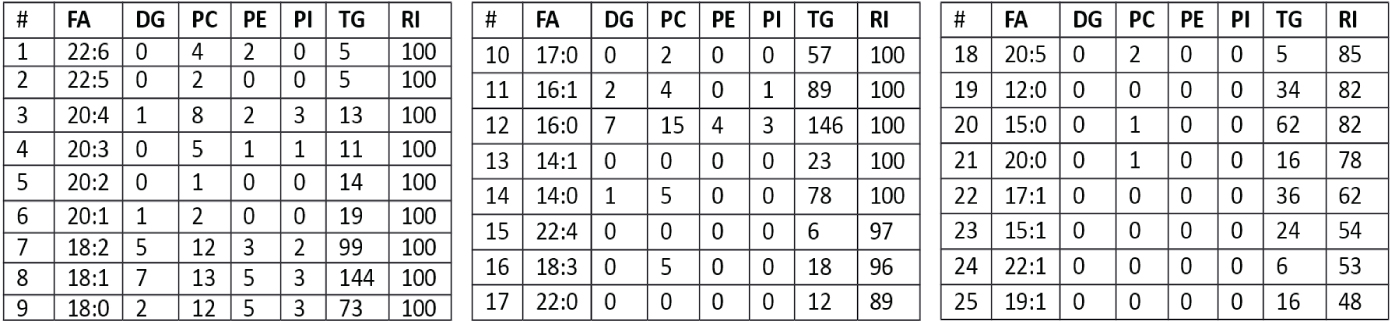
Table 1: List of all the fatty acyls and number of fully characterized lipid species from different lipid classes that have the fatty acyl as one of the Sn1/Sn2/Sn3 chains. RI: Most intense relative intensity of the characteristic ion corresponding to the fatty acyl observed in the MS/MS spectra e.g., Characteristic ions of the neutral loss of fatty acyl 22:6 from parent TG(16:0_18:1_22:6) at m/z 577.5189 was observed as the base peak of the MS/MS spectrum at retention time 16.0859 minute in positive mode.
For detailed regarding the workflow, Please Visit: http://www.premierbiosoft.com/citations/lipidomics-posters-technical-application-notes.html
| Comment | Share |
|


