Home >> Tags >> LC-MS Lipid Data Processing Software
An Integrated Workflow for Profiling and Semi-Quantitative Analysis of Lipids using Agilent 1260 Infinity SFC Coupled with a 6545 LC/QTOF High Resolution Mass Spectrometer with SimLipid ® Software
August 04, 2017
The lipidome covers a range of lipids from non-polar to polar. Profiling experiments often need two or more chromatography separation schemes to cover the range of polarities: a normal phase method and a reverse phase method. Quantitation of the annotated lipids requires investigation using a more targeted approach. We have described a comprehensive analytical method using supercritical fluid chromatography (SFC) coupled to high resolution mass spectrometry for the analysis of lipids covering the whole spectrum of lipid classes in a single run.
The method we have developed is semi-quantitative. Following is a brief description of the method.
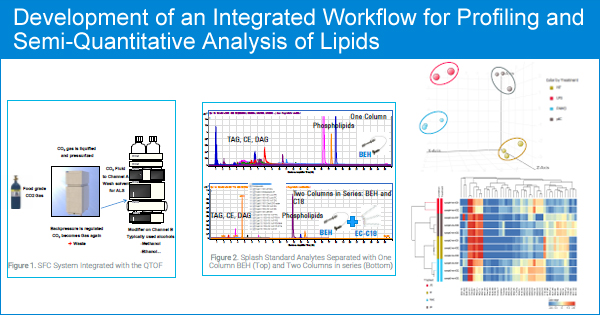
SPLASH™ Lipidomix® Mass Spec Standard - multiple internal standards covering the common lipid classes - are spiked into the sample. A comprehensive lipidomic analysis was performed using an Agilent 1260 Infinity SFC coupled with a 6545 LC/QTOF high resolution mass spectrometer. The identification of lipids using MS/MS data, and subsequent normalization of LC-MS peaks for quantitative analysis of the identified lipids were performed by SimLipid software. We have investigated two peak normalization techniques:
1. The "closest retention time" criteria - the peaks within a retention time window closest to an internal standard representing a lipid class were normalized to the internal standard response.
This worked well but still suffered from the possibility that certain lipids might elute close to an internal standard and not belong to that class of the internal standard.
Hence, we have developed the following technique:
2. The second method of normalization was based on first identifying and annotating the lipids with SimLipid software. The annotated lipids belonging to a certain lipid class were then normalized to the intensity of the internal standard for that lipid class. Unidentified compounds and molecules of a lipid class with no matching internal standard were normalized using the "closest retention time" internal standard response.
Differential statistics was performed on the internal standard normalized data using the above described second normalization technique. We have observed that lipids that were detected by the differential statistics, clearly separated the study groups in the multivariate analysis (PCA, PLSDA) and in hierarchical clustering analysis performed.
For complete poster, please visit our SimLipid Posters & Notes Section.


