Home >> Products >> GlycanExplorer >> Annotated Chromatograms & Mass Spectra
Annotated Chromatogram and Mass Spectrum
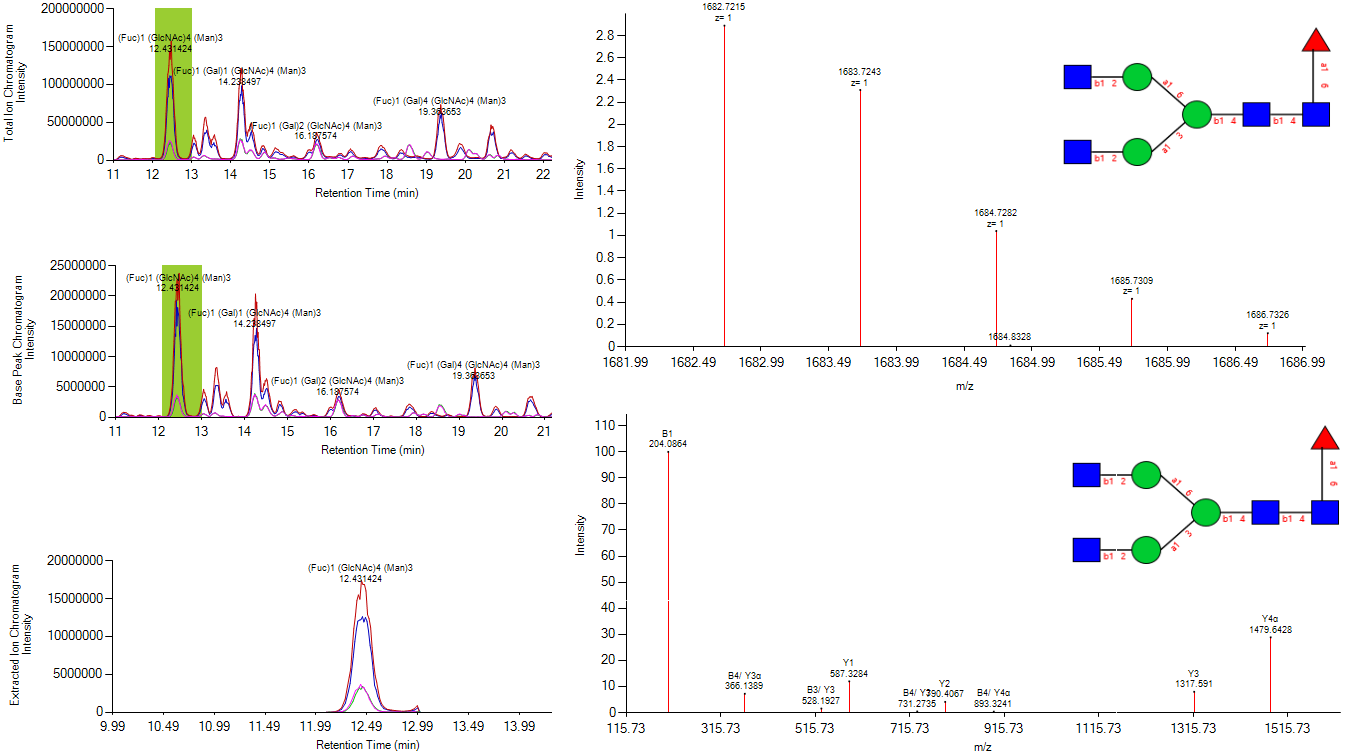
GlycanExplorer helps you see through your data by generating annotated Chromatogram and Spectrum plots. It displays all three chromatograms, Total ion Chromatogram (TIC), Base Peak Chromatogram (BPC), Extracted/Selected ion Chromatogram (XIC/SIC) annotated with glycan composition and retention time. If there are multiple technical replicates of the biological samples, the software displays overlaid chromatogram plots as well.
To visually verify the accuracy of the reported candidate glycan structures, annotated mass spectra and Mirror plot are displayed by the software.
GlycanExplorer has a dedicated Spectrum panel that displays detailed information of the identified glycans along with their experimental and chromatographic information.
Key Features:
1. Annotated MS1 spectrum with well defined isotopologues along with the glycan structure.
2. MS/MS spectrum annotated with structure-specific characteristic ions along with the glycan structure.
3. Mirror plot displays the efficiency of MS/MS spectral database search.
4. Extensive data and display parameters to generate your choice of chromatogram or mass spectra.
5. Display detailed glycan information and corresponding experimental and chromatographic details.